
AI visibility of Flourish embeds
A Flourish embed is a placeholder plus a script that builds the chart in the browser. AI assistants and crawlers usually read a page's raw HTML once and don't run JavaScript, so to them the chart doesn't exist.
There are two fixes. They do different jobs and are complementary — use either or both:
| AI-friendly embeds | Rendering the content yourself | |
|---|---|---|
| What it is | Flourish includes a machine-readable fallback link in your embed code | You put plain HTML about the chart into your page |
| Work involved | None — on for personal accounts, one admin setting for companies | Code in your publishing pipeline |
| Who it helps | AI assistants that follow links — they get the chart's complete, current data | Every AI tool, including crawlers that read a page once and never follow links |
| What it covers | Script embeds of published visualizations | Anything, including stories and Live API charts |
Start with AI-friendly embeds: it costs nothing. Add rendered content where visibility to AI crawlers matters, or where the fallback can't apply (stories, the Live API). The fixes don't interfere with each other — the live demo shows the same page with no fix, the first fix, and both together, ready to fetch or show to an AI tool.
AI-friendly embeds
Note: AI-friendly embeds are on for personal accounts. On company accounts they're off by default, and a company admin can turn them on in the company settings:
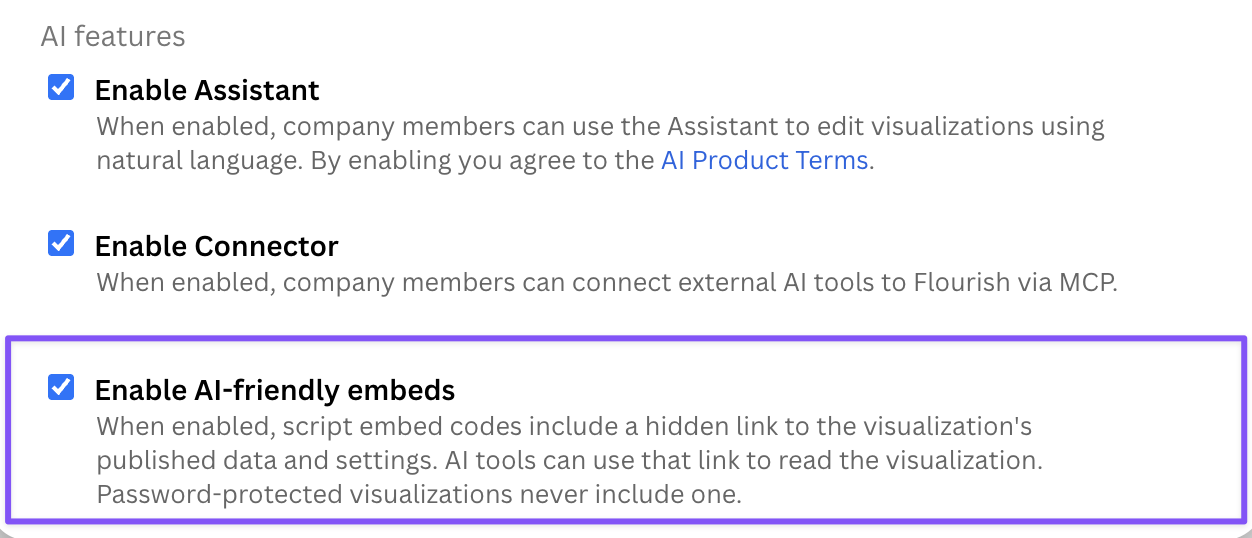
When AI-friendly embeds apply to your account, copied script embed code includes a fallback element after the embed placeholder:
<div class="flourish-fallback" data-for="visualisation/29601929"><a href="https://public.flourish.studio/visualisation/29601929/visualisation.json?ref=embed-script">https://public.flourish.studio/visualisation/29601929/visualisation.json?ref=embed-script</a></div>
The link points to the visualization's public visualisation.json data file, with the URL as the link text because some AI tools only read visible text. The embed script hides all fallback elements as soon as it runs and removes each one when it starts loading that chart, so regular visitors never see the link. Visitors with JavaScript disabled see it as a plain web address under the chart, and AI tools reading the raw HTML can follow it to the chart's data.
Whether the copied embed code includes the fallback depends on your account:
- Personal accounts (not part of a company) always get it, whatever the plan.
- Company accounts get it only when a company admin has turned on Enable AI-friendly embeds under AI features in the company settings. The setting is off by default, and isn't available to companies with encryption enabled.
- Password-protected visualizations never get it, whatever the account.
Iframe and AMP embed codes are unchanged, and stories never include the fallback. Live API charts can't have one either: nothing is published, so there is no data file to link to — see the note below for the fix that works there.
Things to note when integrating:
- Embeds already on your pages don't gain the fallback until you re-copy the embed code. If your CMS builds embed codes itself, add the fallback element to its template. Likewise, turning the setting off only affects embed code copied afterwards — codes already on pages keep the link until replaced.
- When the fallback applies, the Download HTML export includes the
visualisation.jsonfile, and the preferred snippet in itshow_to_embed_me.txtincludes the fallback element. To opt out when self-hosting, omit the fallback element and don't upload the data file. - The fallback grants no extra access: the
visualisation.jsonfile was already publicly available for any published, non-password-protected visualization.
Rendering the content yourself
The second fix is to put readable content about the chart into the page itself, instead of relying on the fallback link. This takes some code: something in your publishing pipeline, such as a CMS plugin or a site build script, has to turn the chart's data into HTML — fetched from Flourish, or taken straight from the table you made the chart from. In return, it works for any account, even when AI-friendly embeds are off for your company. The next two sections cover how to get the content and how to present it.
Getting the chart's content
If you already have the chart's data — the table in your CMS or database that the chart was made from — render from that directly and skip the fetching below. The goal is readable HTML about the chart in the page; where the data comes from doesn't matter.
Otherwise, every published, non-password-protected visualization has a machine-readable copy that updates on every publish:
https://public.flourish.studio/visualisation/{id}/visualisation.json
Visualizations last published before October 2021 don't have this file until they're republished.
For example, you could extract:
- the chart's displayed title (
state.layout.title), falling back to the project name (name) - the description (
state.layout.screenreader_text_primary), written in the editor's accessibility settings; this key is only present when a description has been written - the underlying data (
data), an object keyed by dataset; single-dataset templates exposedata.data, and each dataset is an array of row arrays with the header row first
Some templates also include a top-level metadata object that describes the columns. Inspect your visualization's JSON before writing the code that turns it into HTML, as the exact contents depend on the template.
For example, a build script could turn the file into a title and a table like this:
const viz = await fetch(
    "https://public.flourish.studio/visualisation/27946774/visualisation.json"
).then((r) => r.json());

const title = viz.state.layout.title || viz.name;
const [header, ...rows] = viz.data.data;
const table =
    `<table><tr>${header.map((h) => `<th>${h}</th>`).join("")}</tr>` +
    rows.map((row) => `<tr>${row.map((c) => `<td>${c}</td>`).join("")}</tr>`).join("") +
    `</table>`;
What you extract and render is up to you.
Making chart content AI-readable
Whichever source the content comes from — the fetched visualisation.json or your own data — the markup in the page looks the same. A collapsed <details> block next to the embed works well:
<div class="flourish-embed flourish-chart" data-src="visualisation/27946774">
    <script src="https://public.flourish.studio/resources/embed.js"></script>
</div>
<details class="chart-content">
    <summary>Chart content: pay gap by sector</summary>
    <p>The bar chart shows the gender pay gap for 20 UK sectors in 2025, in percent.
    Mining and quarrying has the widest gap at 26.7 percent, and water and waste
    management is the only sector with a negative gap, at -6.1 percent.</p>
    <table>
        <tr><th>Sector</th><th>Pay gap (%)</th></tr>
        <tr><td>Mining and quarrying</td><td>26.7</td></tr>
        <tr><td>Financial and insurance</td><td>22.3</td></tr>
        <!-- ... one row per sector ... -->
    </table>
    <p><a href="https://public.flourish.studio/visualisation/27946774/visualisation.json">https://public.flourish.studio/visualisation/27946774/visualisation.json</a></p>
</details>
The example follows the rules below: a full-sentence summary, the complete table, and the data link with the URL as its text. (When the data comes from your own pipeline rather than Flourish, drop the link or point it at your source.)
Whatever you choose to show:
Keep it visible, or in a collapsed
<details>block, placed beside the embed — not inside iframe tags, since AI pipelines discard those.Avoid the words "embed" and "hidden" in class and id names, and write descriptions as full sentences; some pipelines filter fragments out as boilerplate.
Prefer readers not to see it? Hide it with a line of JavaScript after page load, never with CSS or attributes in the markup (
display: none, off-screen positioning). AI tools read the raw HTML but don't run scripts, while statically hidden text is stripped by some pipelines and is against Google's spam policies. For the markup above, this script at the end of the page is enough:<script> document.querySelectorAll(".chart-content").forEach(function (el) { el.hidden = true; }); </script>If you link to the interactive version or the data, use the URL itself as the link text; some AI tools only see link text, not link targets.
Live API charts
For charts built with the Live API, rendering the content yourself is the only fix: a Live API chart is never published, so there is no visualisation.json and no fallback link, and the chart renders into an iframe that AI tools discard. The data in your page's script tags doesn't help either — most AI pipelines strip scripts.
The good news is that this fix is easiest for Live API users: your page already holds the data it passes to the chart, so render a sentence and a data table from it next to the chart's container, following the guidance above. The live demo includes a Live API page with and without this fix.
What may change
AI tools change behavior within months, so re-check periodically. Fetch your page with curl, confirm your content is in the raw HTML, then ask an assistant what your chart shows.
The visualisation.json endpoint is the stable contract, whether you rely on the built-in fallback link or render the content yourself.