Using a control sheet
Note: the Flourish API is an enterprise-level bolt-on and not available to all customers
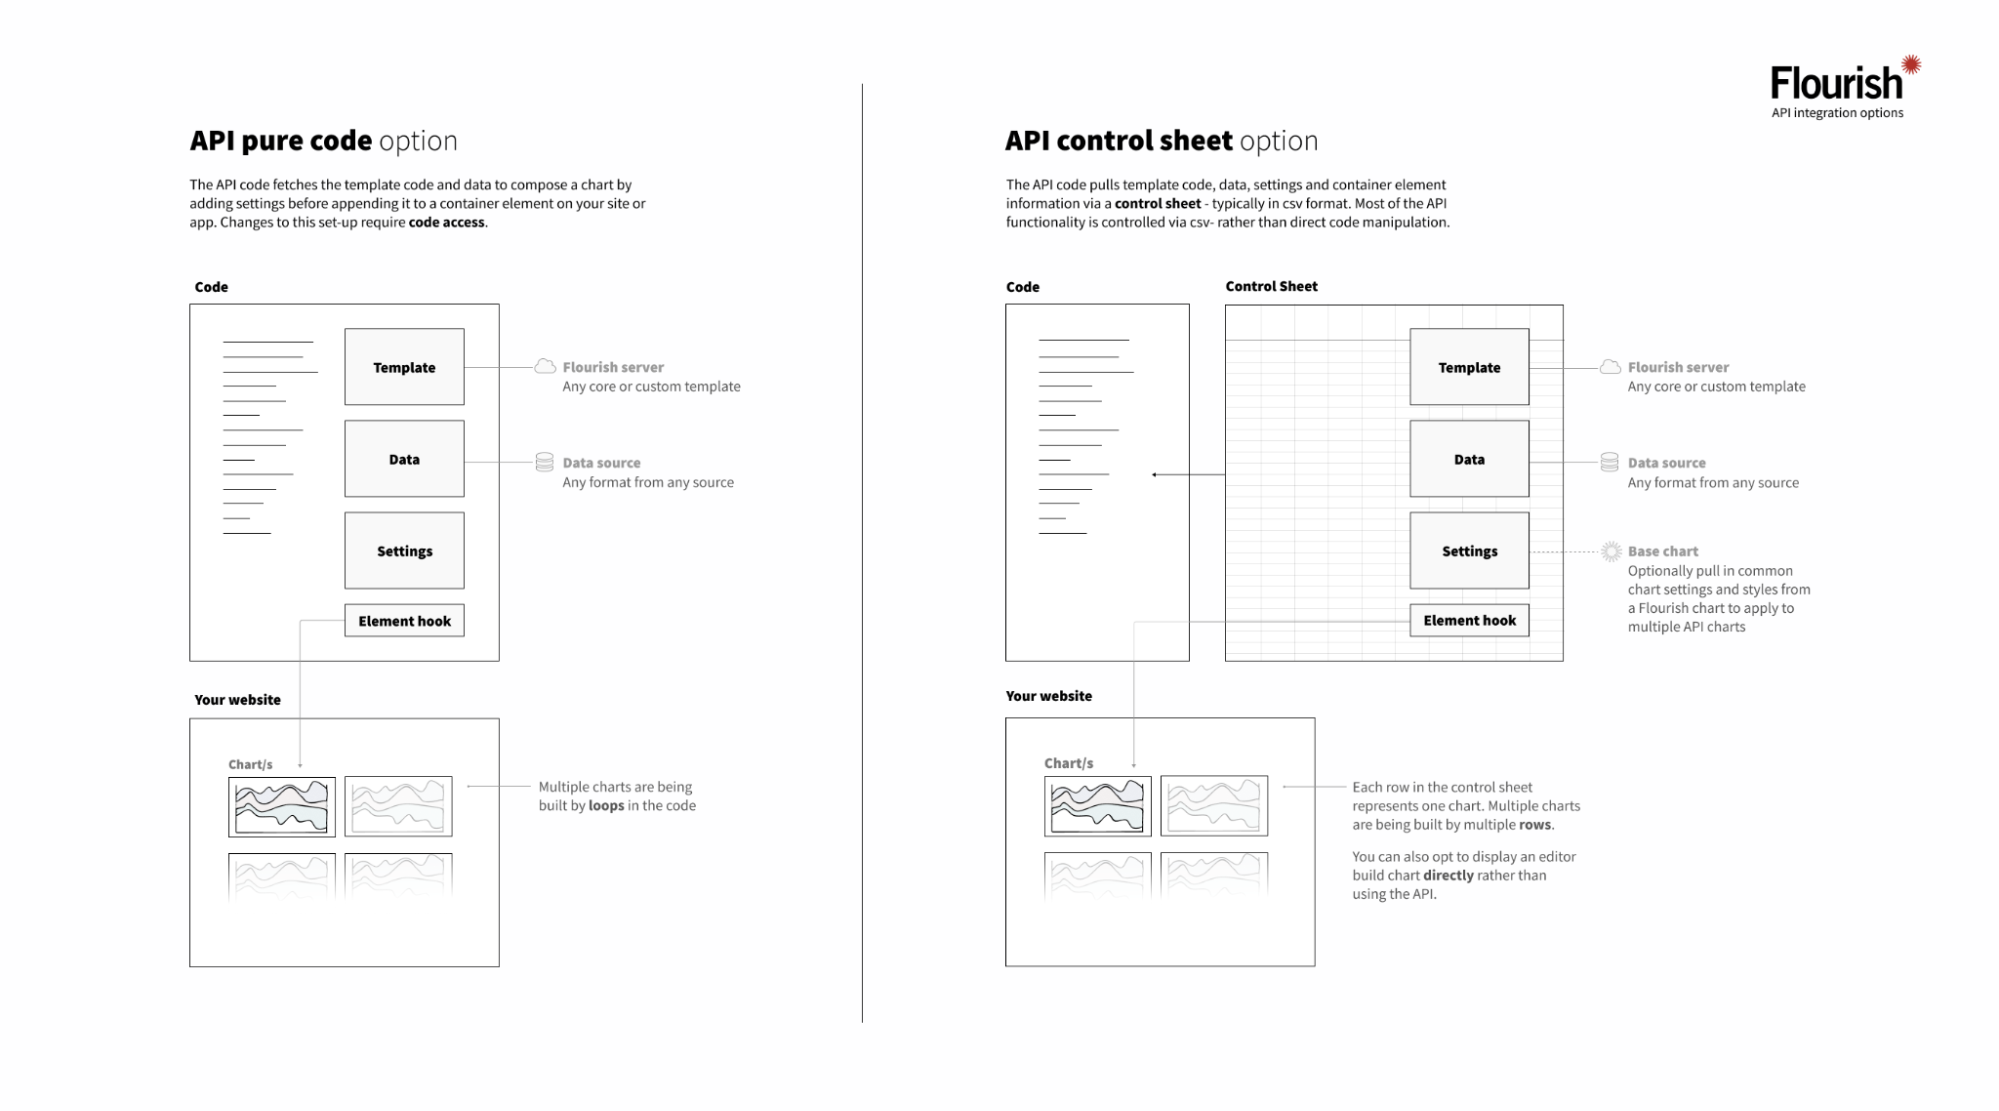
There are three ways to use the Flourish API at the moment:
- API pure code option
- API chart endpoints option
- API control sheet option
The API pure code option is coding based but comes with a lot of power and flexibility, while the API control sheet option helps with the problem of not being a coder!
Using the control sheet option, crucial API control elements can be outsourced into a spreadsheet (the control sheet) which is loaded by the site code. This means that the user doesn't need to touch the underlying API code to manage changes, but can make them in the control sheet.
You are first creating a template visualization in the Flourish editor which will be your base chart as it will provide some base configuration like template type, version, settings and optionally data to build on. You can then amend and overwrite settings from the comfort of your control sheet without having to make changes to the underlying code. You can also update the base chart's settings in the editor and once republished, those changes will feed through to all API visualizations using the changed base chart.
Via the control sheet the user can:
- Select a chart-specific data source
- Specify the chart template and assign a base chart
- Change base chart settings
- Change specific chart settings
- Add data filters and variable selections
Pure vs. control sheet: required skills / differences
| Pure API version | API control sheet version | |
|---|---|---|
| Setting up the charts | Write the code in javascript | The code that pulls in the control sheet and sets up the settings to be changed via the control sheet needs to be written. Plus, create and populate the control sheet. |
| Updating & making changes | Make changes in the API code in javascript | Make changes in the control sheet |
| Connect the data | From any source | From any source |