Replicating a visualization
Note: the Flourish API is an enterprise-level bolt-on and not available to all customers
It's often useful to replicate a visualization made in the app, using the API. But figuring out all the settings, data and bindings that come together to make a visualization can be time-consuming. Instead, there are a couple of options that speed up this process.
For unpublished visualizations
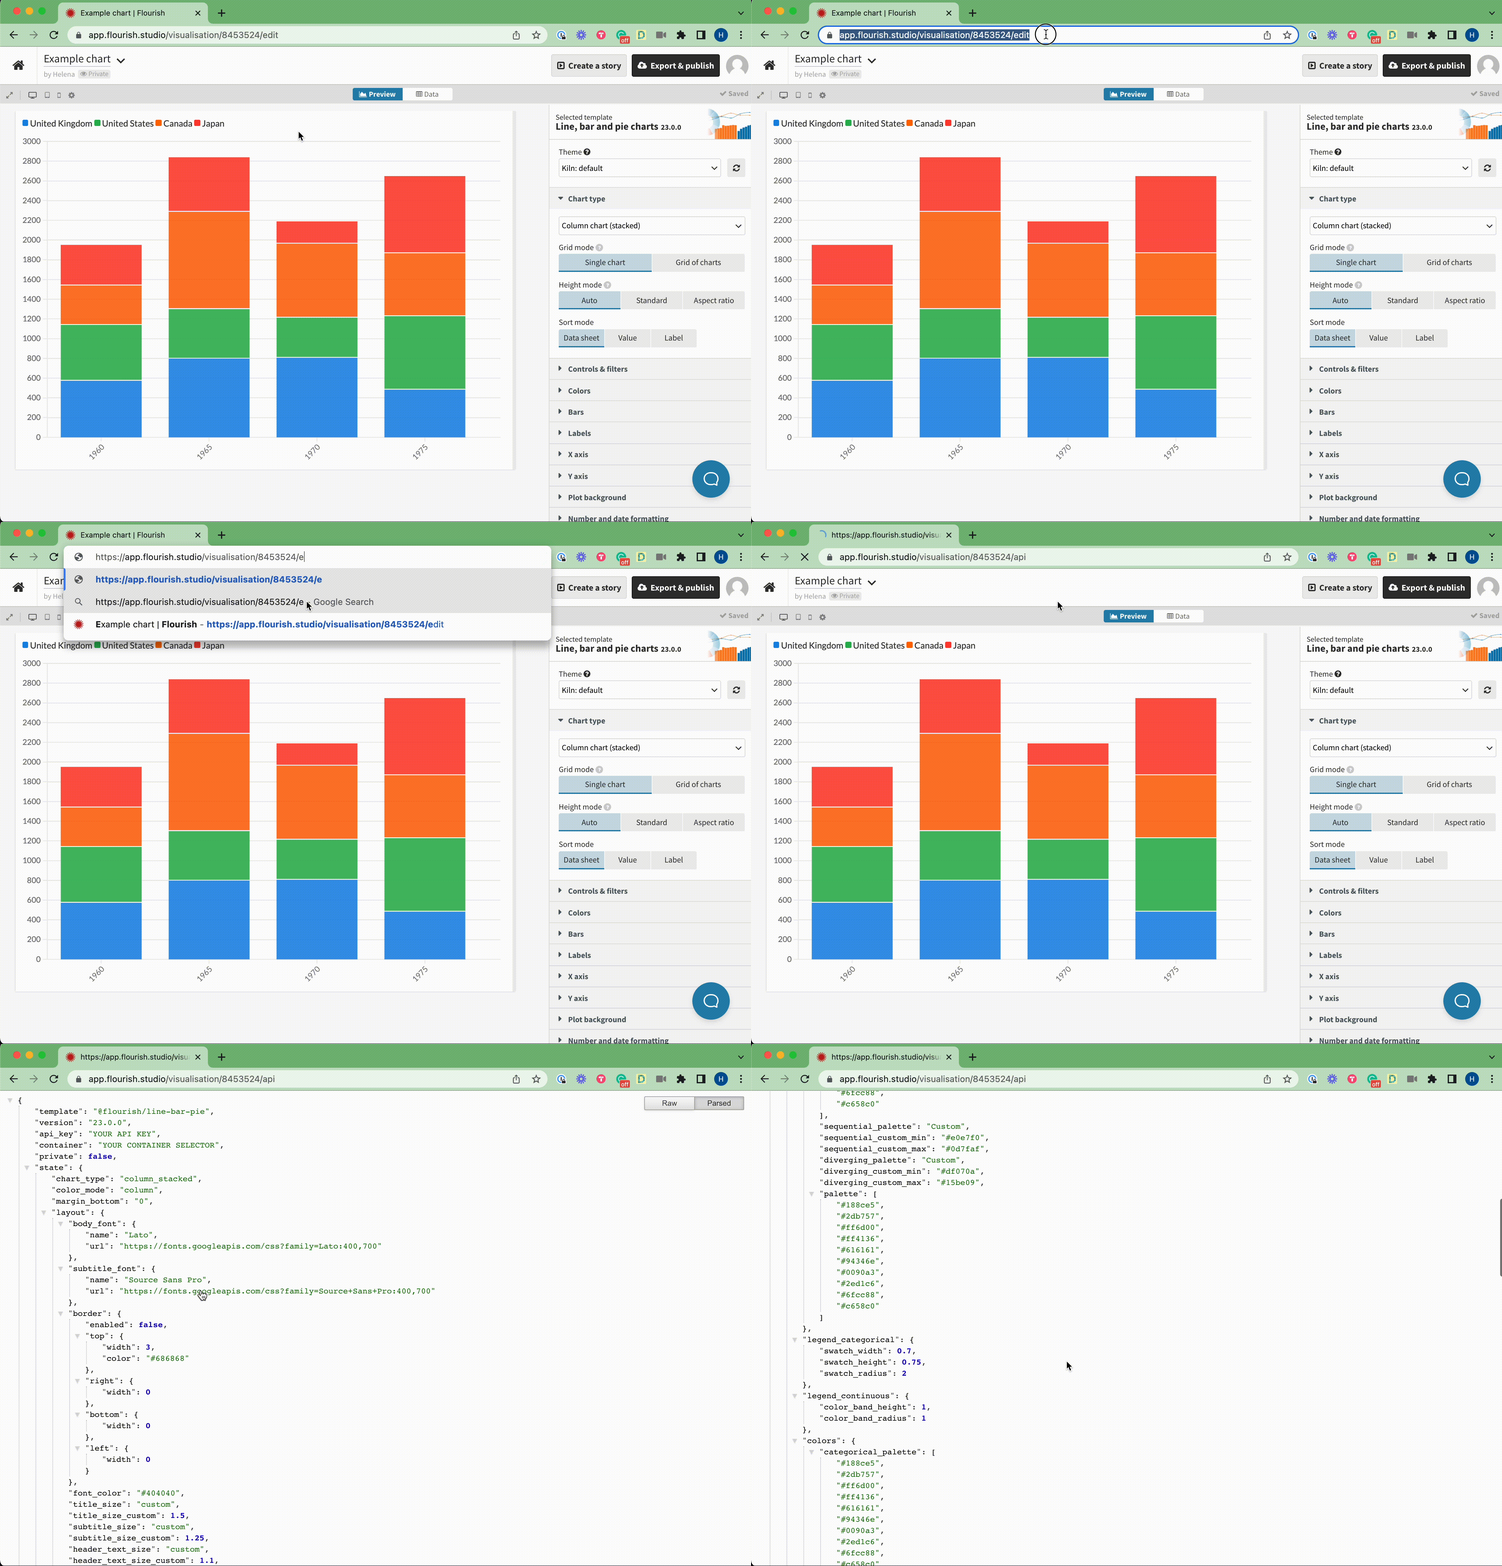
When working on a visualization in the app's editor, if you replace /edit at the end of the URL with /api you can retrieve the full JSON configuration of that visualization, which you can pass to the API (having added your API key) to recreate the graphic.

As this endpoint is available for unpublished projects, you'll need to be logged into your account and either the owner of the visualization or part of the company in which it was created.
If you need to fetch a visualization dynamically without needing to login, read on for an easy way to recreate published visualizations using the API.
For published visualizations
As well as creating API visualizations from scratch, it's possible to pass in the ID of a base visualization made in the app when calling the API.
You can create "templates" in the app using dummy data that include default settings that you'll always want your API charts to apply, and then simply override data, bindings and any additional settings where necessary to efficiently generate consistent graphics every time.
This workflow becomes even more powerful when it comes to updating your styling. Simply update the default settings of your templates in the app, republish them, and all API visualizations that used the templates' configuration will update accordingly.
1. Create & publish your base visualization in the app
You can use the default data in the template and simply style the visualization to your preference with the settings panel. Alternatively, if you have a specific data structure, add some dummy data to the template and customize your base visualization from there.
Once you're done, hit the Export & publish button.
2. Call the API passing in base_visualisation_id
Make your API call passing in just three key parameters: your API key, the container where the visualization should be embedded, and the ID of your base visualization (you'll find this in its URL in the app), like so:
var my_visualization = new Flourish.Live({
    container: "#chart",
    api_key: "************ YOUR API KEY GOES HERE! ************",
    base_visualisation_id: "8453558"
})
This will create the base visualization, including all of its data, bindings and settings. If you're just wanting to directly replicate a chart made in the app, then voila, you're done! But a typical workflow is to just use this as a base visualization, and then override some of its properties to create new charts. That's next!
3. Override data, bindings & any additional settings
Now you have a chart styled the way you want, but you need to swap out the data and bindings to create the desired chart. To do so, just add these properties to the object you're passing the API. For example,
var my_visualization = new Flourish.Live({
    container: "#chart",
    api_key: "************ YOUR API KEY GOES HERE! ************",
    base_visualisation_id: "8453558",

    data: {
        data: [
            {
                "Year": 1960,
                "United Kingdom": 578,
                "United States": 566,
                "Canada": 400,
                "Japan": 407
            },
            {
                "Year": 1965,
                "United Kingdom": 802,
                "United States": 503,
                "Canada": 986,
                "Japan": 548
            },
            {
                "Year": 1970,
                "United Kingdom": 811,
                "United States": 407,
                "Canada": 750,
                "Japan": 221
            },
            {
                "Year": 1975,
                "United Kingdom": 488,
                "United States": 745,
                "Canada": 638,
                "Japan": 777
            }
        ]
    },
    bindings: {
        data: {
            label: 'Year',
            value: ['United Kingdom','United States','Canada','Japan']
        }
    },
});
You can also add or modify settings, by adding a state object like this:
    state: {
        layout: {
            title: "This is my new chart title",
            source_name: "I am a source",
        },
        y: {
            linear_max: 4000
        }
    }
Any new settings here will be added to the state, and existing ones will be overwritten.
4. Later... update your base visualization & see the magic happen!
Imagine you've successfully replicated several charts with the API based on a single base visualization, applied the necessary overrides and they are live on your site. But, a couple of months down the line your branding guidelines have been updated.
You can just make the necessary styling changes to that base chart in the app, hit republish, and all of your API charts created from that base visualization will updated accordingly, without having to delve into the API code or repeat the process for each chart.
Take a look at this workflow in action below, or check out the examples on the next page.
