Working with data
In many cases, the user wants to visualize some kind of data in a Flourish template. That's why it's possible in Flourish to upload a CSV or XLS file into a template.
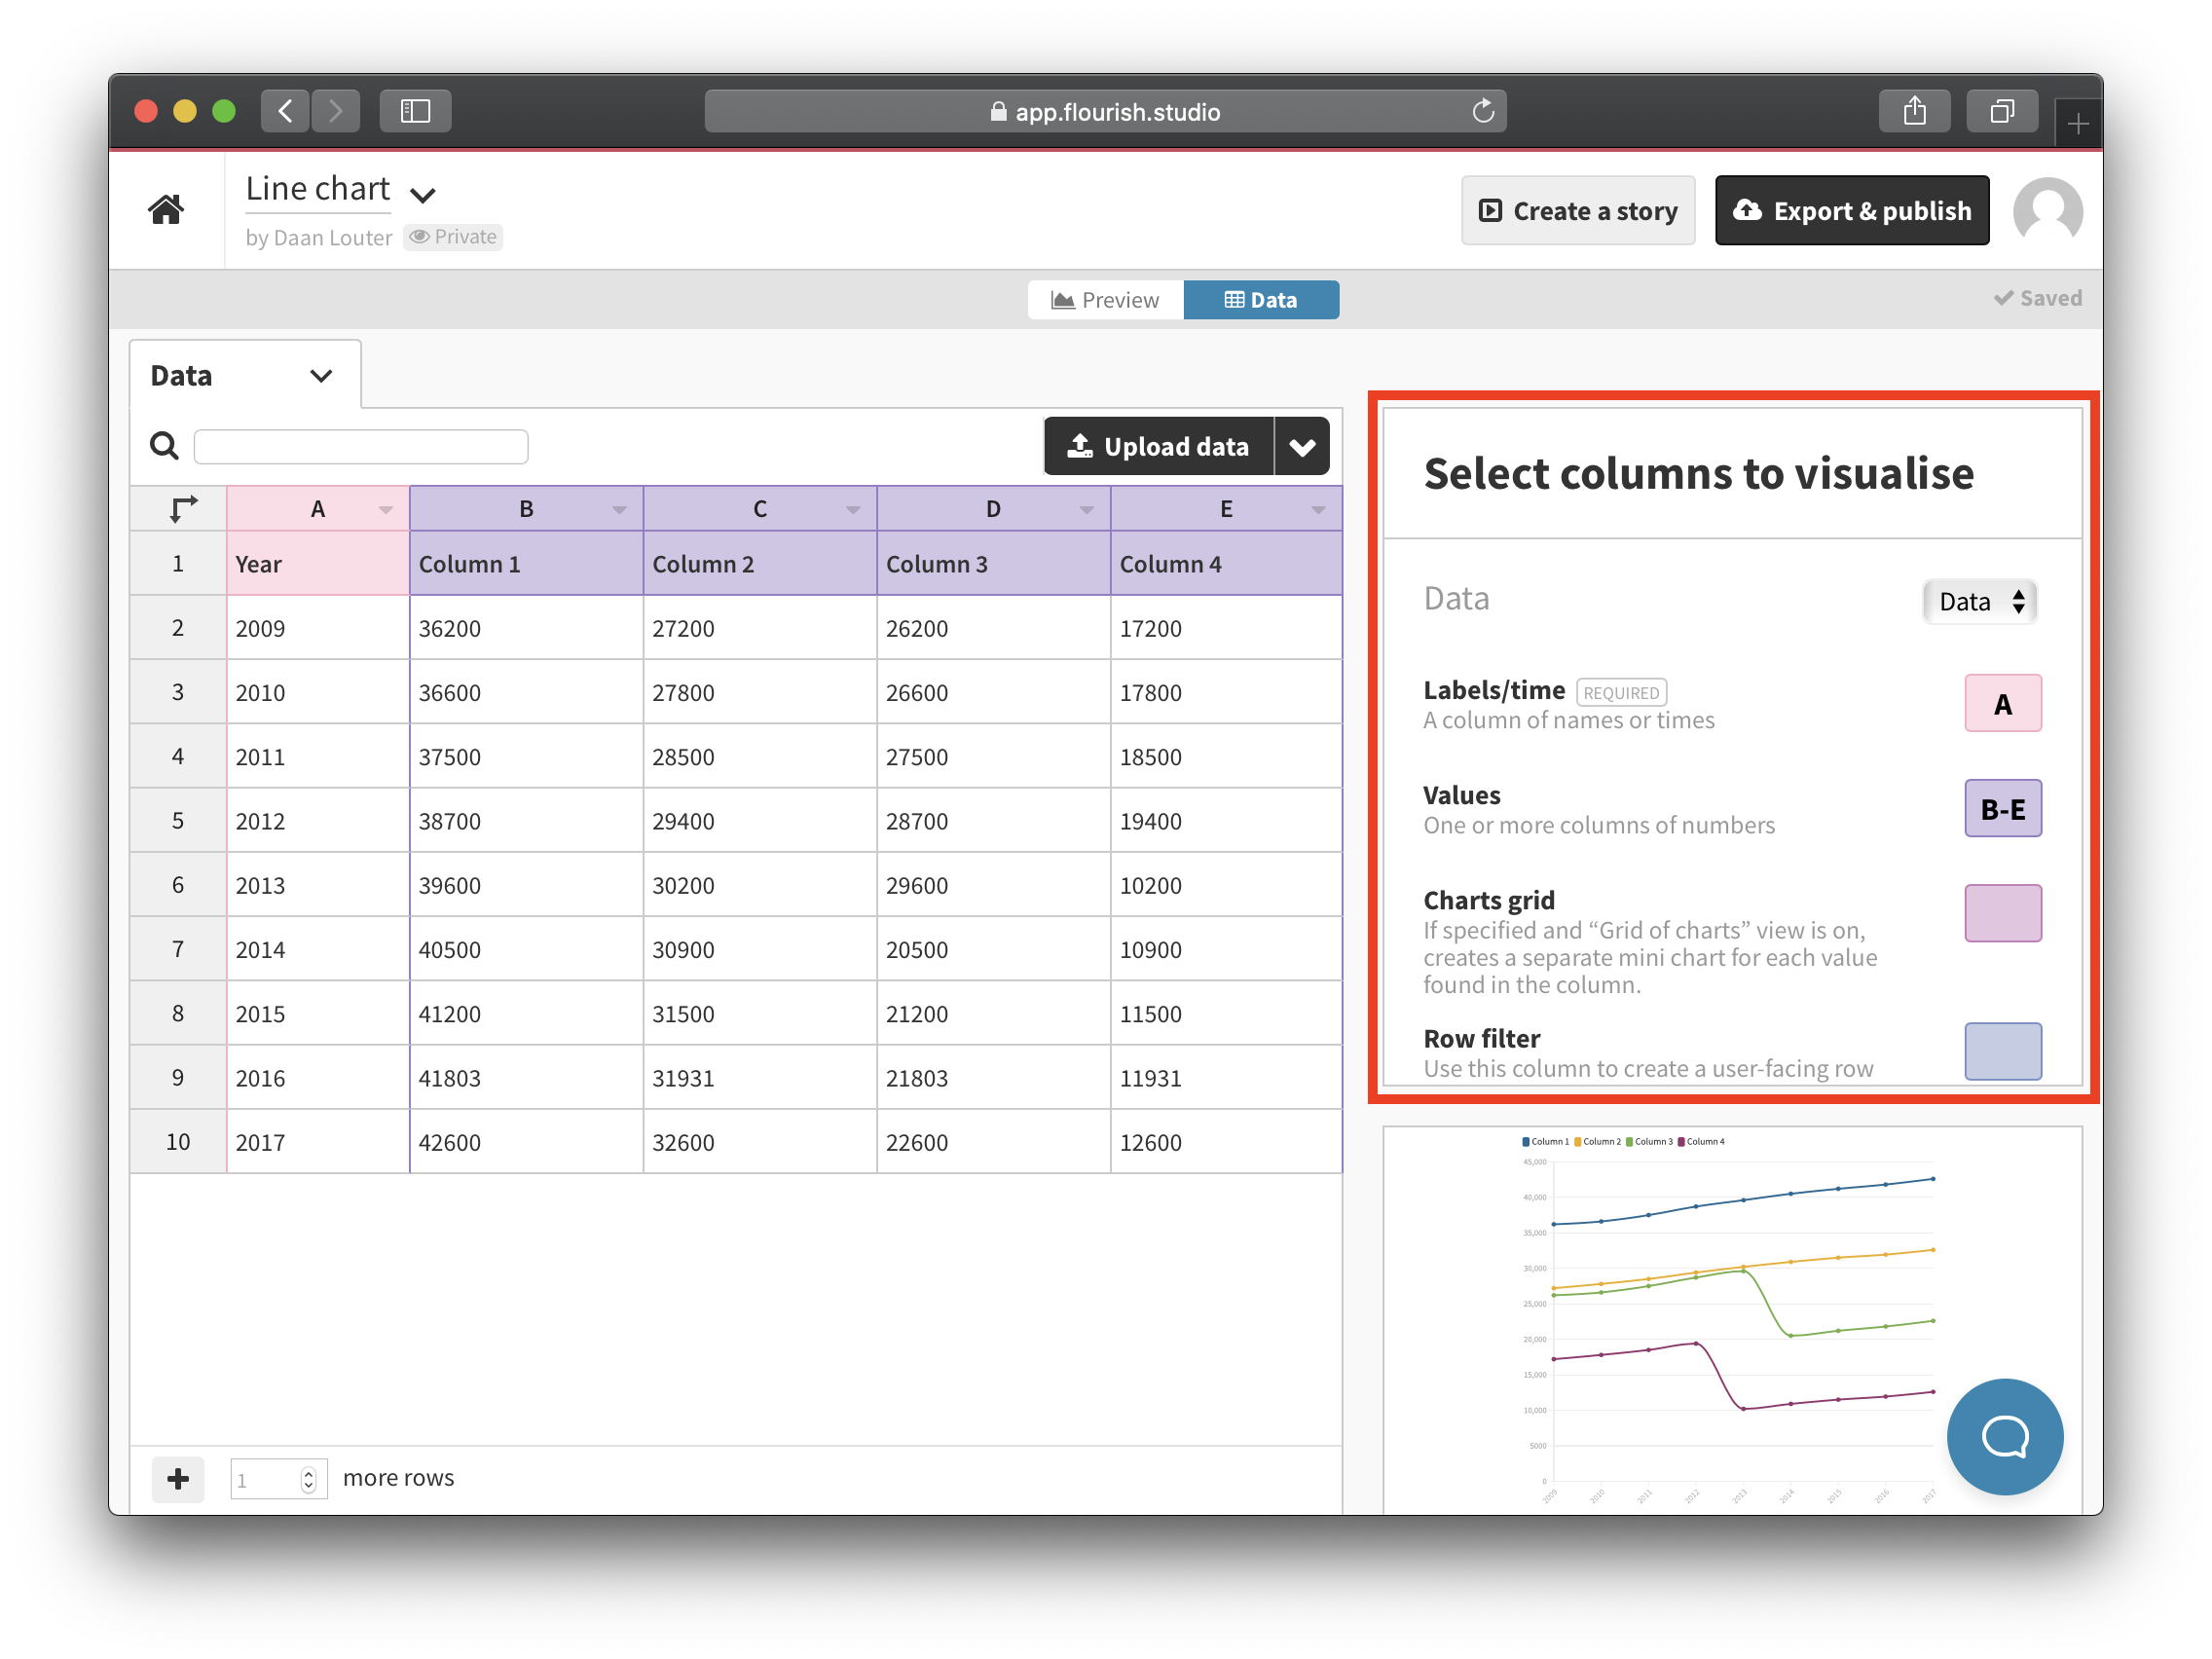
 The Data tab in the Flourish app (this view is not available in the SDK)
Creating sample data
The SDK doesn't have a Data tab like the screenshot above, so it's not possible to see or upload data in the SDK. Instead, you can use a local data file. To do this, go to your template directory, create a new folder called data, and in that folder create a new CSV file, e.g. Data.csv that includes some sample data:
Fruit,Sold
Apples,5
Bananas,6
Oranges,2
Using the data in your template
Now we need to load the data into the template. Since users can upload any CSV into Flourish, we can't always assume the data and columns are in a certain order. The column you want to use as a value could be in Column A, or in Column D, or Column ZZ! That's why we're using some called data bindings. A data binding is a user-controllable column selection that tells the template which columns to use for what.
For example, in our test template we want to create a data binding for Labels/time and point it to Column A ("Fruit"), and we want to create a data binding for Value and point it to Column B ("Sold").
Data bindings are invisible in the SDK, but you can see them in the Flourish app when going to the Data tab in a visualization editor.
So let's create the two data bindings for label and value. Open the template.yml file. At the bottom, you should see a data block. Take a look at the API reference for the full documentation. For now, we’re adding these two data bindings:
data:
  - key: label # Property name in the dataset
    name: Label # Name to be displayed in the editor
    dataset: data # Name of dataset
    type: column # Are we selecting a single or multiple columns
    column: "Data::A" # Which column should be selected
  - key: value
    name: Value
    dataset: data
    type: column
    column: "Data::B"
Now in your src/index.js do a console.log(data) in your draw() or update() function and you'll get something like this:
{
    data: [
        {label: "Apples", value: "5"},
        {label: "Bananas", value: "6"},
        {label: "Oranges", value: "2"},
        column_names: {label: "Fruit", value: "Sold"}
    ]
}
You can now use this data in your template. There is also a column_names property. This can be used to display the column names in the visualization (for example as labels on a line chart, or for extra information inside a popup).